Analysis of the Structure of the University Rankings
Deconstructing the evaluation system through data analysis
The Problem
Every year, numerous university rankings are published globally.
The Times Higher Education (THE) ranking is one of the most influential.
The official indicator weights are public. But does the data actually match the methodology?
- Is the ranking truly transparent?
- Which of the five indicators truly drives a university’s final position?
The Data
Source Dataset: 2,603 records | 818 Universities | 72 Countries
Analysis Focus: 2015 dataset (201 top universities).
Preparation:
- Excluded range ranks (e.g., “201-250”)
- Handled missing values
- Removed irrelevant descriptive columns
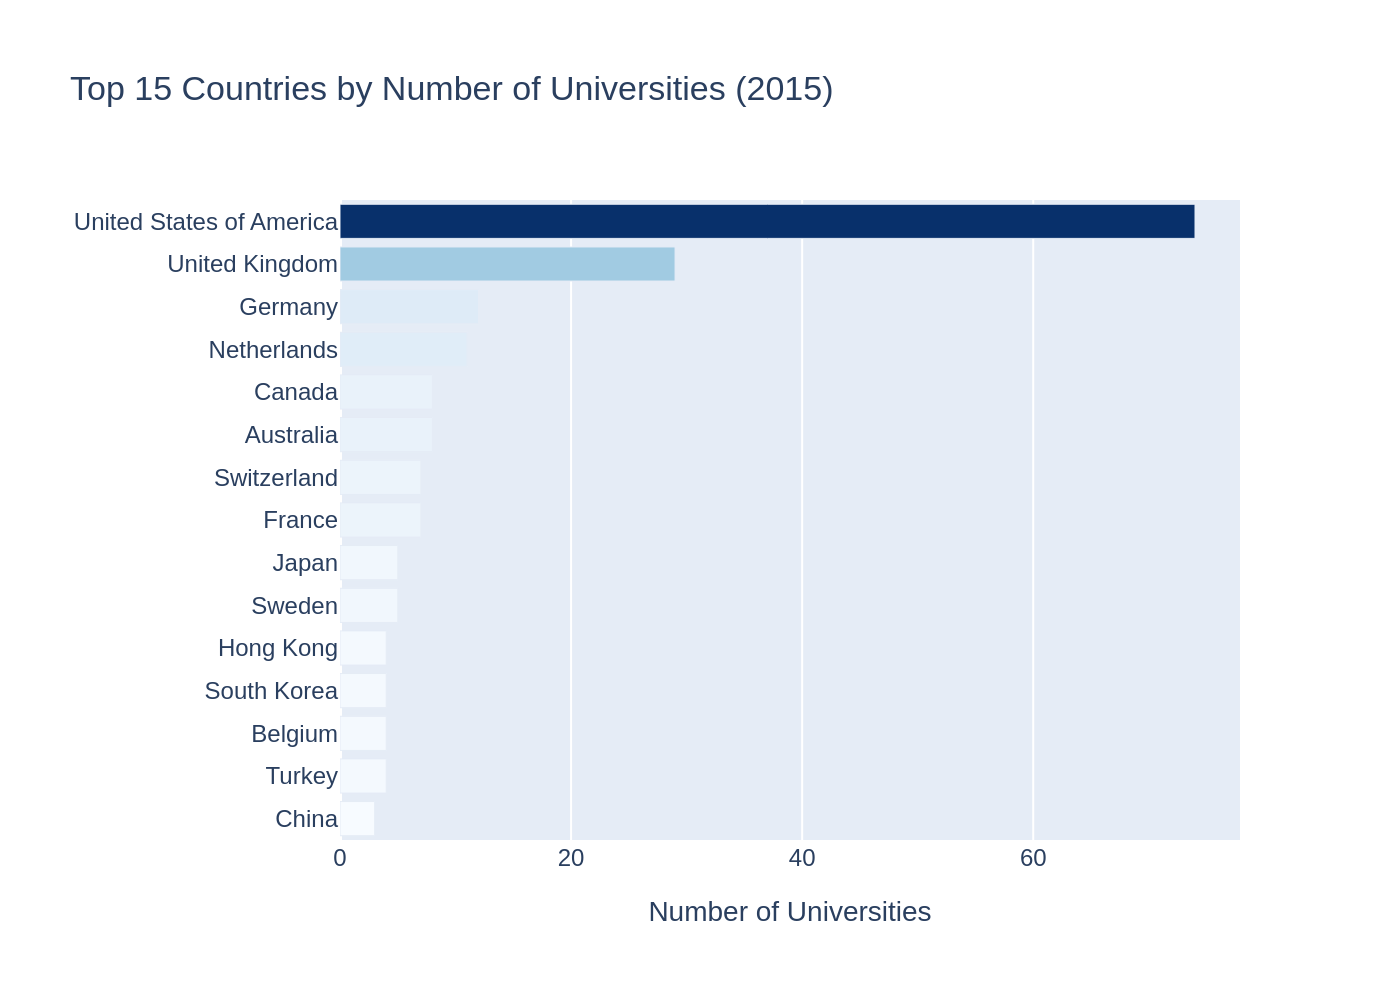
Geography of Global Leaders
The distribution of top universities is not even.
It shows massive geographical concentration:
- United States: 74
- United Kingdom: 29
- Germany: 12
Geography of Global Leaders
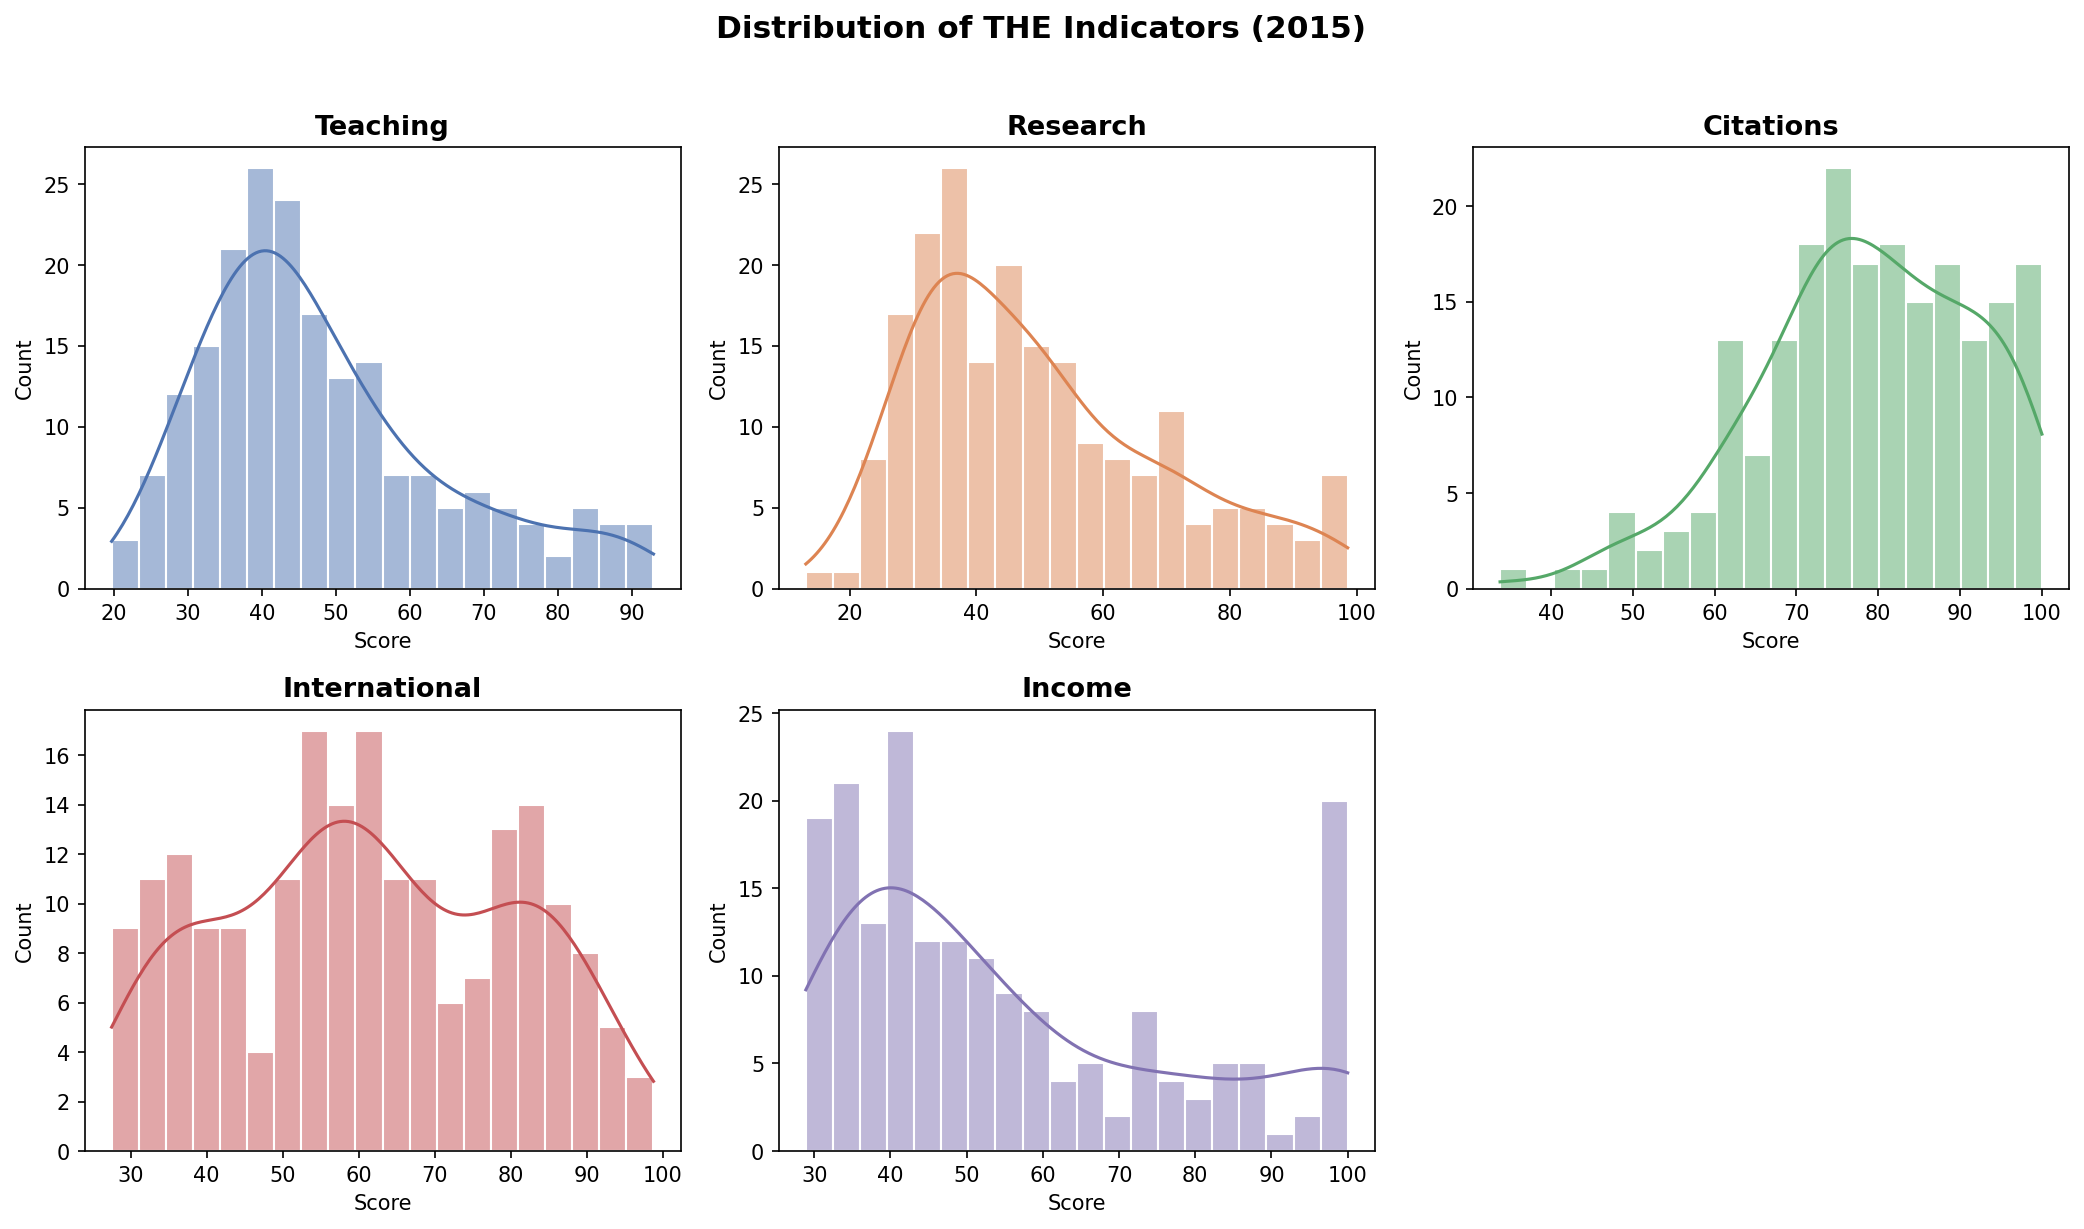
Score Distributions
How do the indicators behave statistically?
- Citations: 78.6 (High mean score)
- Teaching & Research: \(\approx\) 49 (Moderate mean)
- Income: 55.5 (High variability)
Score Distributions
The Gradient Approach
How can actual empirical weights be found?
The final score \(S\) must be treated as a mathematical function of five variables.
By applying linear regression, it is possible to extract the gradient components:
\[\nabla S = \left( \frac{\partial S}{\partial Teach}, \frac{\partial S}{\partial Res}, \frac{\partial S}{\partial Cit}, \frac{\partial S}{\partial Int}, \frac{\partial S}{\partial Inc} \right)\]
Empirical vs. Official Weights
Is the THE ranking a “black box”?
No. The empirical calculations show near-perfect agreement with the stated methodology.
| Indicator | Empirical Weight | Official Weight |
|---|---|---|
| Teaching | \(\approx\) 30% | 30% |
| Research | \(\approx\) 30% | 30% |
| Citations | \(\approx\) 30% | 30% |
| International | \(\approx\) 7.5% | 7.5% |
| Income | \(\approx\) 2.5% | 2.5% |
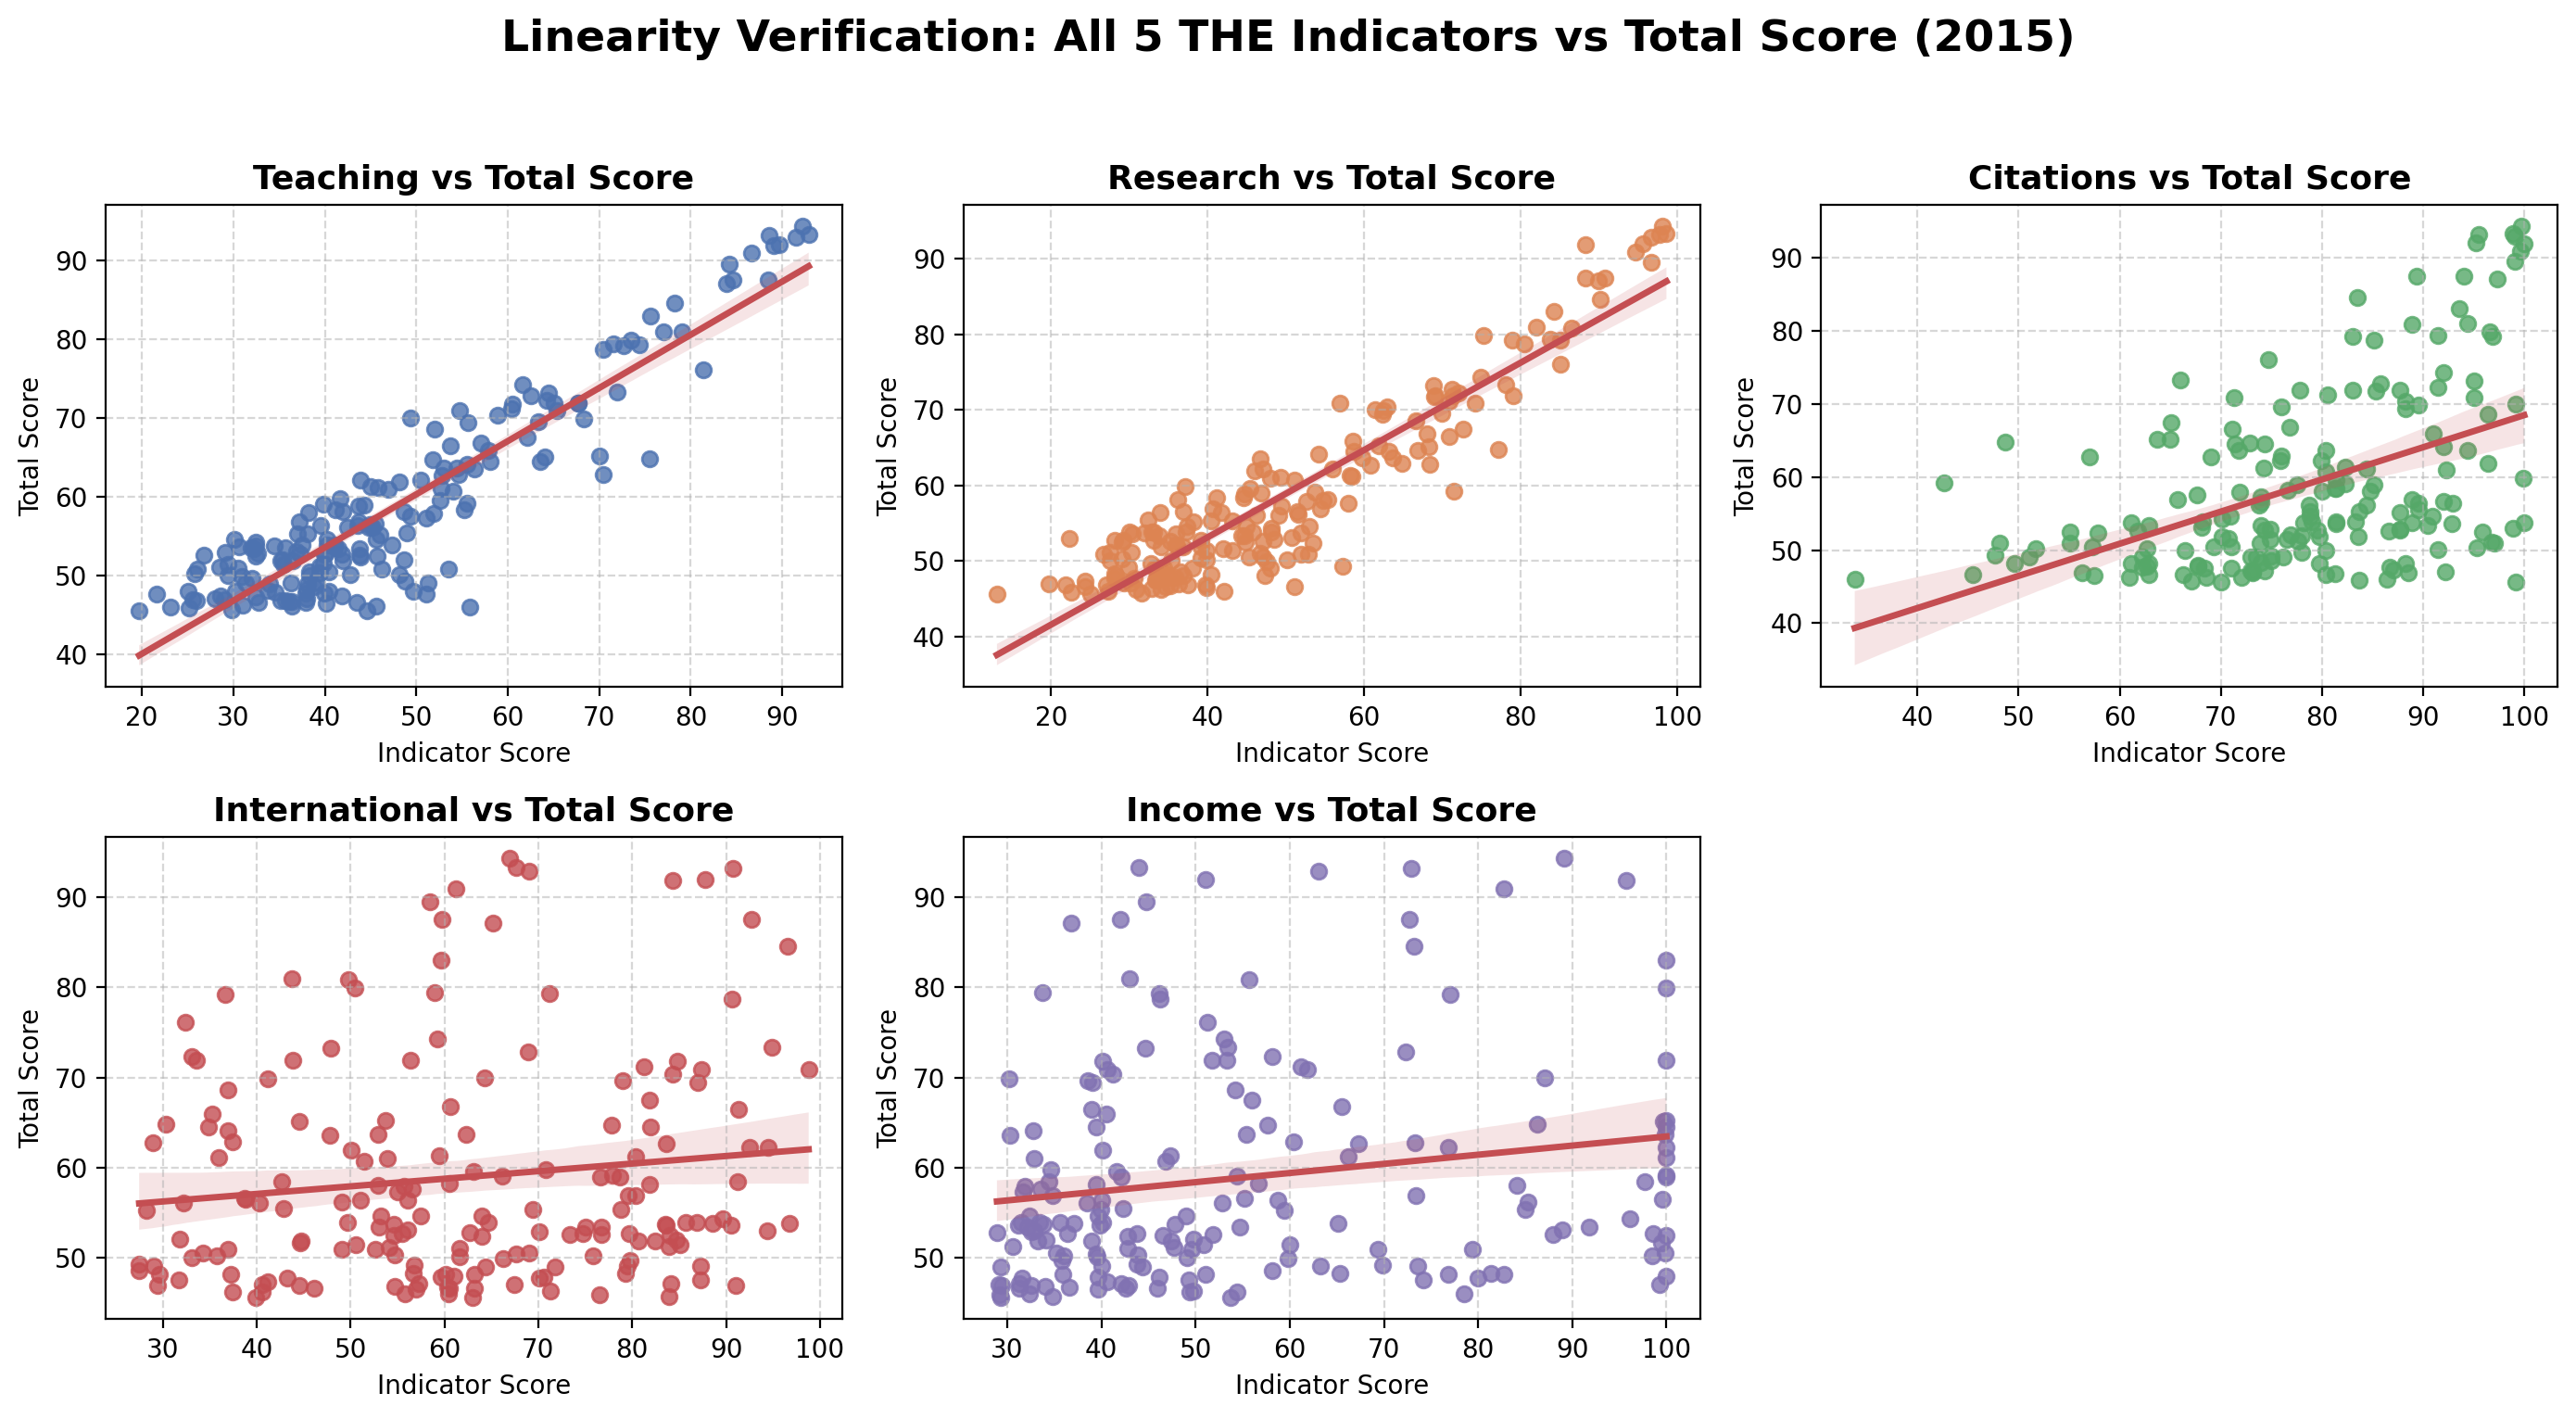
Linearity Verification
The relationship is strictly linear for the “Heavyweight Pillars”.
International and Income show much higher dispersion.
Linearity Verification
Final Takeaways
1. Transparency Confirmed The system is mathematically predictable. If you know the formula, you know the rank.
2. Strategic Focus To reach the top, a university must excel in the “Big Three” (Teaching, Research, Citations) — they control 90% of the outcome.
3. Geographical Bias The current 30/30/30 structure inherently favors the Anglo-Saxon university model, cementing the US and UK dominance.